Key Takeaways
- Raw scores measure momentary recall, while retention efficiency curves measure long-term mastery and learning velocity.
- AI pattern recognition identifies systemic curriculum gaps rather than isolated student errors, enabling targeted instructional adjustments.
- LMS integration requires careful metric mapping, scheduled data syncs, and verification of gradebook compatibility.
- Privacy compliance relies on data minimization, anonymization, encryption, and transparent governance practices.
- Effective implementation follows incremental calibration, starting with one module, tracking retention curves, and scaling proven adjustments.
Introduction
If you have spent years reviewing quiz results, you already know the quiet frustration of looking at a spreadsheet full of scores and still not knowing what actually happened in the classroom. An eighty-two percent average might look solid on paper, but it rarely tells you whether students truly understand the material or simply memorized it for the test. Traditional grading measures a snapshot. It does not measure learning velocity, retention decay, or the hidden prerequisites that are quietly holding students back.
AI-powered assessment analytics changes that dynamic. When implemented thoughtfully, these tools do not just grade faster. They surface the structural patterns in how your cohort engages with content, where knowledge fractures occur, and which instructional adjustments will actually improve long-term mastery. The shift here is subtle but critical: we are moving away from treating scores as final judgments and toward treating them as diagnostic signals. This guide walks through how educators can leverage AI-generated quiz data to map retention efficiency curves, identify cohort-level gaps, integrate with existing learning management systems, and maintain strict privacy compliance throughout the process. You will leave with a clear, practical framework for turning raw assessment data into actionable curriculum insights.
Why Raw Scores Mislead: Introducing Retention Efficiency Curves
A raw score answers one question: how much could a student recall at the exact moment they took the quiz. It does not tell you whether that knowledge will still be there in two weeks, two months, or two semesters. In cognitive science, this is well-documented. The forgetting curve is steep, and without structured reinforcement, even high-scoring students lose significant retention within days. This is where retention efficiency curves become far more useful than averages.
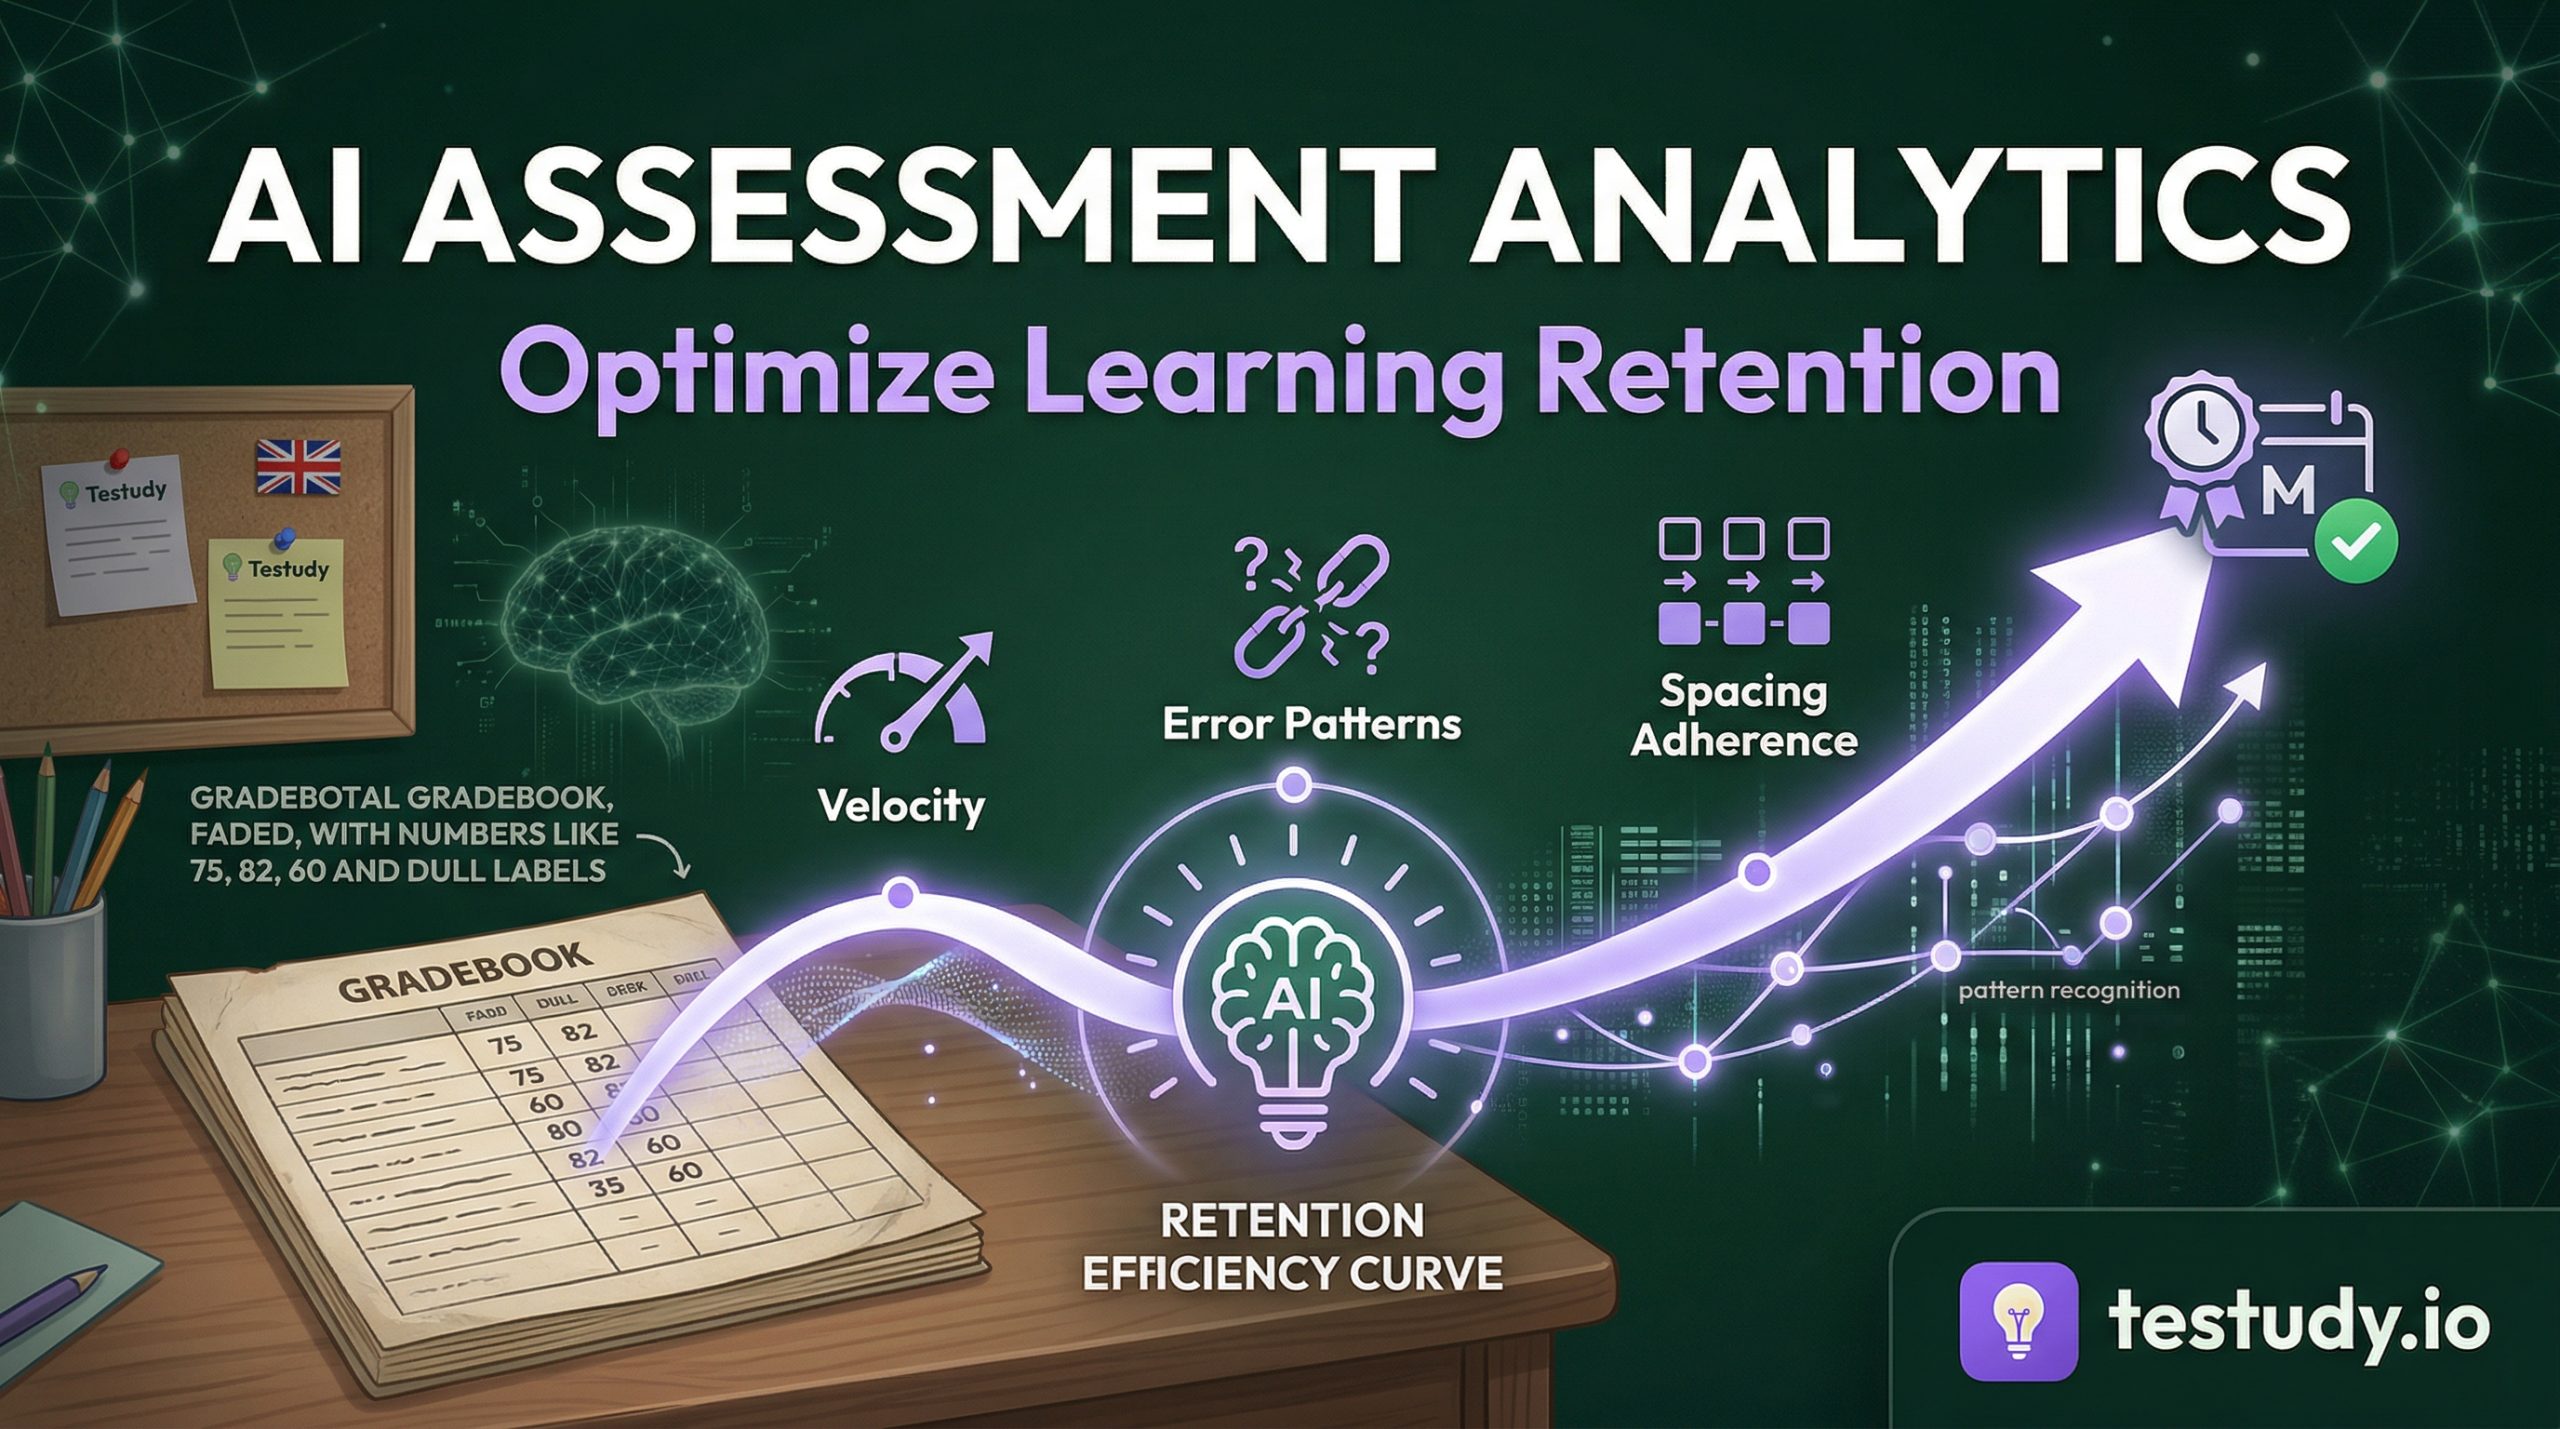
A retention efficiency curve tracks how quickly students demonstrate mastery, how long that mastery persists, and how effectively they recover knowledge after a review cycle. When AI assessment platforms measure this, they do not just log correct answers. They track response latency, pattern consistency across spaced intervals, and error types. A student who answers correctly on the first attempt but struggles with delayed recall shows a different learning profile than a student who initially guesses incorrectly but consistently improves across subsequent review sessions.
Educators often feel pressured by institutional reporting that prioritizes high averages. Shifting the focus to retention efficiency does not mean ignoring grades. It means using grades as an entry point rather than an endpoint. When you start measuring how efficiently knowledge is retained and reactivated, you gain visibility into instructional effectiveness that raw scores simply cannot provide. The curve flattens when teaching aligns with cognitive architecture. It drops when content is delivered without reinforcement or when prerequisite knowledge is assumed rather than verified. Reading these curves correctly allows you to adjust pacing, introduce targeted review cycles, and intervene before minor gaps become systemic failures.
Identifying Cohort Knowledge Gaps Through AI Pattern Recognition
When thirty students miss the same question, it is rarely a coincidence. Traditional grading often treats this as a collective underperformance. AI analytics treat it as a curriculum signal. Pattern recognition in assessment data works by clustering responses, isolating question variants, and mapping error distributions against specific learning objectives. The goal is not to flag struggling students. It is to identify where the instructional sequence itself may be misaligned.
For example, an AI platform might detect that students consistently struggle with application-level questions in a specific module, while performing well on definition-based prompts. This pattern usually indicates a gap between conceptual exposure and practical integration. Another common signal appears when students answer correctly on first exposure but show high error rates after a week. This points to insufficient spacing or weak active-recall scaffolding. AI does not guess at these conclusions. It aggregates response data across multiple quiz attempts, filters out statistical noise, and highlights recurring breakdown points.
The most effective use of this data happens when you cross-reference AI reports with classroom observation. If the analytics show a gap in a specific concept, ask yourself whether the original instruction assumed prior knowledge, whether the examples provided were too abstract, or whether practice opportunities were insufficient. You will usually find that the data confirms what you already sense, but with precision. This removes the guesswork from curriculum adjustments and replaces it with targeted intervention. You do not need to redesign an entire unit. You only need to adjust the specific friction points the data reveals.
Integrating AI Quiz Data with Existing Grading Systems and LMS Dashboards
The analytical value of AI quizzes means very little if the data remains trapped in a standalone interface. For educators and administrators, seamless integration with existing Learning Management Systems (LMS) and grading platforms is non-negotiable. This is where most implementation friction occurs, but it is also where the workflow becomes sustainable.
Integration typically works through standardized export protocols. Most modern LMS platforms support CSV, Excel, or direct API connections that pull gradebook entries, attempt histories, and competency tags. The key is mapping AI-generated metrics to your existing grading schema before deployment. Start by defining which AI outputs will sync automatically. Retention efficiency scores, gap alerts, and mastery thresholds can be exported alongside traditional grades if your LMS supports custom columns or rubric alignment. If your system has stricter limitations, prioritize exporting mastery indicators and scheduling manual review cycles for the deeper analytics.
When setting up the sync, verify three things. First, ensure question-level data aligns with your learning objectives rather than arbitrary quiz titles. Second, confirm that automated grade transfers do not overwrite manual adjustments you have made for accommodations or extensions. Third, establish a clear schedule for data refreshes so that your LMS dashboard reflects current performance rather than stale snapshots. A weekly sync is usually sufficient for most course structures. Daily updates can create unnecessary noise, while monthly updates delay actionable insights.
If your institution relies on legacy grading systems with limited export capabilities, you can still benefit from AI analytics. Export the data independently, run your review cycles outside the LMS, and upload only the finalized competency grades. The system does not need to be perfect to be useful. It needs to be consistent. Once the integration is stable, your dashboard becomes a living record of cohort progress rather than a static archive of completed assessments.
Privacy-Compliant Data Handling for Student Records
Data analytics in education carries inherent responsibility. Student records are protected under frameworks like FERPA in the United States and GDPR in Europe, and those standards are not optional add-ons. They are foundational requirements for any AI tool that processes assessment data. The good news is that compliant data handling does not require sacrificing analytical depth. It requires intentional architecture.
Privacy compliance starts with data minimization. AI platforms should only collect what is necessary for assessment analytics. Personal identifiers can be masked or tokenized during processing, allowing the system to analyze patterns without exposing individual student identities to unnecessary risk. When exporting data to external systems or third-party dashboards, ensure that anonymization protocols remain intact. Retention curves and cohort gap reports do not require names to be actionable. They require accurate response data and consistent tagging.
Consent and transparency are equally important. Students and guardians should understand what data is being collected, how it is used, and who has access to it. Clear privacy policies, accessible opt-out mechanisms where legally required, and institutional data governance reviews establish trust before the first quiz is deployed. Testudy’s compliance framework, for example, outlines how AI-generated assessments maintain strict data isolation, encrypt transit and storage, and adhere to regional regulatory standards without compromising analytical functionality.
If you are unsure whether your current setup meets compliance thresholds, start by auditing your data flow. Map where information originates, where it is processed, where it is stored, and who can view it. Remove unnecessary retention periods. Limit administrative access to role-based permissions. Document your review cycles. Compliance is not a one-time checklist. It is an ongoing practice that aligns with ethical teaching. When privacy is handled correctly, it does not restrict innovation. It enables it by ensuring that analytics serve learning without compromising trust.
From Data to Curriculum Redesign: Actionable Implementation Steps
Analytics only create value when they translate into instructional action. The transition from reviewing reports to adjusting curriculum can feel overwhelming if approached as a complete overhaul. Instead, treat it as a continuous calibration process. Start small, measure the impact, and scale what works.
Begin by selecting one module or unit where AI analytics have highlighted a consistent knowledge gap. Review the retention efficiency curve for that section. Identify whether the drop occurs immediately after initial instruction or during delayed recall phases. Adjust the pacing accordingly. If retention drops quickly, introduce shorter, more frequent review cycles using active-recall prompts. If the curve shows steady improvement but plateaus below mastery, examine the complexity of practice questions and ensure they align with real-world application rather than rote recognition.
Next, update your assessment structure. Replace low-value, high-volume quizzes with targeted checks that measure specific competencies. Use AI-generated questions to fill gaps in your existing question bank, but always review them for contextual accuracy before deployment. Automated generation is a starting point, not a final product. Human calibration ensures that the questions reflect your instructional voice and academic standards.
Finally, establish a feedback loop. Share anonymized cohort trends with students when appropriate. Explain why certain review cycles exist and how the spacing supports long-term retention. Students perform better when they understand the methodology behind the workload. Track your adjustments over a full academic term. Compare retention curves before and after implementation. Document which changes reduced cognitive load and which ones improved mastery thresholds. Over time, you will build a personalized instructional playbook that aligns with how your specific cohort learns. The goal is not perfection. It is predictable, measurable progress.
Conclusion
Assessment analytics should never be treated as a replacement for instructional expertise. They are diagnostic instruments that make the invisible visible. When you shift your focus from raw scores to retention efficiency, you stop asking whether students performed well on a single day and start asking whether your teaching structure supports lasting mastery. AI pattern recognition helps you locate gaps before they widen. LMS integration keeps your workflow sustainable. Privacy compliance ensures that innovation never comes at the cost of trust. The path forward does not require a complete curriculum overhaul. It requires steady, data-informed adjustments that respect how learning actually happens. If you approach AI assessment tools as partners in instructional design rather than automated grading shortcuts, you will find yourself spending less time guessing and more time teaching with precision. Start with one unit, track the retention curve, adjust the pacing, and let the data guide your next step. Clarity compounds over time, and your students will notice the difference long before the final exam.
Food for Thought
If your current grading system only captures final scores, what learning patterns might you be missing between the first quiz and the final exam?
When reviewing a cohort gap report, consider whether the breakdown stems from content complexity, pacing, or missing prerequisites before adjusting the material.
If you feel uncertain about integrating AI analytics with your existing workflow, start by mapping one competency metric to your gradebook and observe how it changes your instructional planning over a single unit.
Frequently Asked Questions
How do retention efficiency curves differ from traditional grading averages?
Traditional averages measure performance at a single point in time. Retention efficiency curves track how quickly students acquire knowledge, how long they retain it, and how effectively they recover it after review. This reveals whether instruction aligns with long-term mastery rather than short-term recall.
Can AI analytics accurately identify knowledge gaps without bias?
AI identifies statistical patterns in response data, but it does not replace human judgment. Accuracy depends on proper calibration, diverse question sets, and educator review of outlier results. When used as a diagnostic signal rather than a final verdict, AI reduces subjective grading bias while highlighting systemic curriculum gaps.
What happens if my LMS does not support direct API integration with AI quiz platforms?
You can still utilize the data by exporting standardized CSV or Excel reports. Map the AI-generated metrics to custom columns in your existing gradebook, schedule regular manual updates, and prioritize syncing mastery indicators rather than raw response logs. Consistent manual integration is highly effective when automated sync is unavailable.
How can I ensure student data remains compliant while using AI assessment tools?
Prioritize data minimization, tokenization of personal identifiers, and strict role-based access controls. Verify that your platform encrypts data in transit and at rest, adheres to FERPA or GDPR standards, and provides clear documentation on data retention periods. Regular audits and transparent privacy policies maintain compliance without limiting analytical functionality.
Will implementing AI analytics significantly increase my administrative workload?
Initial setup requires mapping metrics to your existing grading schema and configuring export schedules, which typically takes a few hours. Once integrated, AI reduces manual grading time, surfaces actionable insights automatically, and consolidates data into a single dashboard. The long-term workload decreases as routine assessment tasks become streamlined.
How often should I adjust my curriculum based on AI-generated gap reports?
Curriculum adjustments should follow your instructional cycle rather than real-time data spikes. Review cohort analytics weekly for pacing adjustments, implement structural changes at the end of each module, and evaluate long-term retention trends each semester. Incremental calibration prevents overcorrection while ensuring steady improvement.